


Web Stories Data Studio Dashboard provides easy access to performance data
In a recent blog on Google for Creators, Google provided some useful ways to track the performance metrics of web stories. It explained how Google Analytics can be used to gauge the performance of web stories. Also, a Google Data Studio template was shared for uncovering key insights.
Key metrics you can track with the Web Stories Data Studio Dashboard
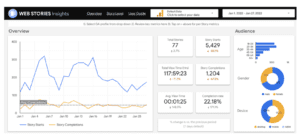
Google has inserted charts and graphs in the Data Studio Report to help users track essential metrics when evaluating the performance of web stories. These metrics include:
Story Starts
A metric will helps you understand how many users have started reading your story.
(referred to as pageviews in Google Analytics)
Top Stories
This section will show you the top 10 stories on basis of the time period selected. (The list is sorted in descending order by Story Starts)
Story Completions
A metric that shows how many users finished your Story by reaching the last page. (referred to as story_completion events in Google Analytics)
Total and Average View Time
This metric will help you identify how much time users spend reading the web story. This is useful in understanding user behavior.
Audience
The audience section will show metrics such as the gender and age of the users that read your story. It will also give you a bifurcation of the device type.
Traffic channels
This section shows the various sources of your traffic including Organic Search, Paid, Direct, Social or Referral traffic.
Story Level Insights
The detailed breakdown of each web story can be found on page 2 of the Web Stories Data Studio Report. You can select the story you want to analyze from the drop-down menu. This section will give you access to “page-level” data.
How to set up the Data Studio report?
You can access the Web Stories Data template report here. To generate your report, simply follow these simple steps:
Step 1: Open the template and log in with your Google account (Make sure login with the account that has access to Google Analytics data.)
Step 2: You may be asked to verify. (Follow the on-screen steps to verify your account)
Step 3: Click on the tab with the Analytics icon
Step 4: Now select the “View” that you want to analyze
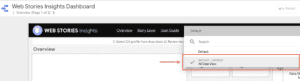
The metrics for your Web Stories will now appear.
Key Takeaway
The Data Studio Template for Web Stories provides an intuitive and efficient way to analyze performance data. It is a great way of automation for agencies that evaluate web stories on a daily, weekly, or monthly basis. You can also retrieve past data by selecting the date range in the Data Studio report. Google believes that the metrics will assist site owners in improving their web stories and overall user experience.
![]()