


Creating the best version of your website is an exercise in continuous improvement, leveraging data to drive decisions. One critical method to achieve this is through A/B testing, where different versions of web elements are compared to determine which performs better in engaging users and delivering a higher return on investment (ROI). By analyzing the outcomes of these A/B tests, website owners can understand the preferences of their visitors and refine their campaigns effectively.
Optimizing a website to achieve the best user experience requires a data-driven approach, where the utilization of A/B testing is paramount. These tests help website owners understand which variations of their key campaigns and web pages resonate most with users, leading to a higher ROI. Combining A/B testing with SEO services allows you to align user preferences with search engine requirements, driving both visibility and conversions.
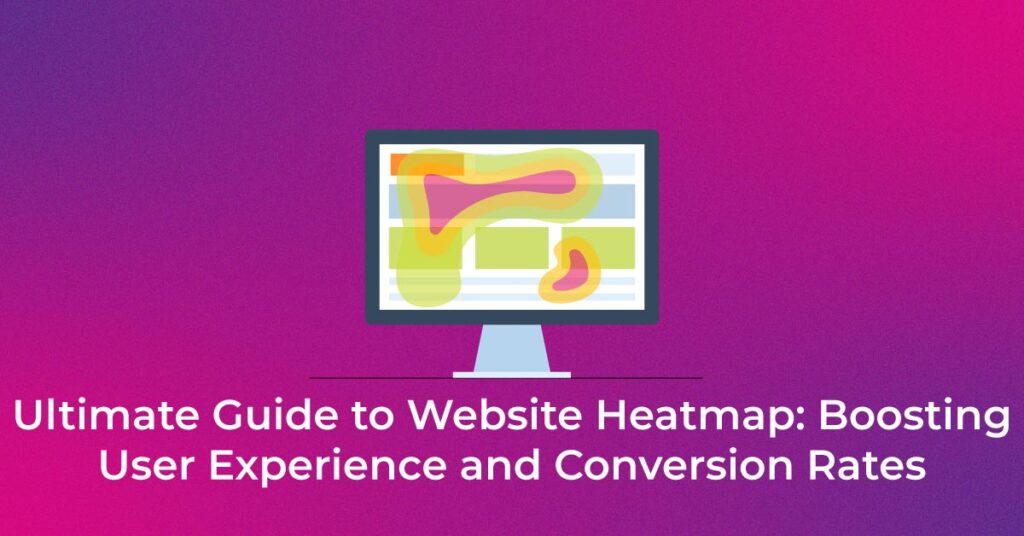
What Is a Website Heatmap?
A website heatmap is a powerful visualization tool that provides a color-coded representation of user behavior on web pages. It offers a tangible way to understand what users are doing on your site by visually tracking their interactions. Here’s how it works:
- Click Tracking: Heatmaps highlight the areas where users most frequently click on a page. This includes buttons, links, images, and any other clickable elements. The areas with the most clicks are usually displayed in warm colors (like red), while less clicked areas appear in cooler colors (like blue). This data is crucial for understanding which parts of the page are effectively capturing user attention and prompting action.
- Scroll Tracking: Scroll heatmaps provide insights into how far down users are scrolling on your web pages. They show whether important content is being seen or if it’s falling below the “fold,” where users tend to lose interest and stop scrolling. This information can help determine if you need to rearrange your content to ensure the most valuable information is immediately visible.
- Mouse Movement: By tracking mouse movements, heatmaps can give an indirect indication of where users are looking and what content they are reading. The premise is that mouse movement can correlate with eye movement, suggesting that where the cursor goes, the eyes follow. This insight allows Website heatmaps are a form of data visualization that helps website owners understand how visitors interact with their websites. The fundamental purpose is to show where users click, scroll, and move their mouse on web pages. Here’s a breakdown of how it visualizes user behavior:
- Attention Heatmaps: These show which parts of your website are viewed the most. By combining data from mouse movements, clicks, and scroll depth, attention heatmaps estimate A website heatmap is a visualization tool that employs colors to display various forms of user activity on a web page. By tracking where users click, how they scroll, and their mouse movements, heatmaps provide insights into user behavior that can help website owners optimize the user experience. Here’s a simple overview of how this tool visualizes user interactions:
Heatmaps utilize a spectrum of colors to illustrate the intensity of activity in different parts
How Heatmaps Improve Website UX and Conversion Rates
Heatmaps are powerful visual tools that represent the collective engagement of website visitors, translating complex data into colorful, intuitive graphics. They are integral to CRO strategies, helping to identify usability issues, optimize content placement, and enhance the user journey—all critical factors for improving website conversion rates. Here’s how heatmaps contribute to these aspects:
Identifying Usability Issues:
- Data from heatmaps vividly illustrate areas on a webpage where users most frequently click, hover, or scroll, revealing the hotspots of activity and zones that are ignored. This direct feedback can pinpoint obstacles or frustrations users may encounter.
- For example, a heatmap may show that users frequently attempt to click on an element that is not interactive, indicating a possible misunderstanding or a missed opportunity for engagement.
- Additionally, scroll heatmaps can reveal if vital content is being missed because it’s placed too far down on the page, prompting a potential redesign to ensure important information is within the immediate view upon page load.
Optimizing Content Placement:
- Heatmaps direct attention to the most viewed and interacted-with areas on a webpage. This allows for strategic content placement in these high-traffic zones to capture user attention where it naturally falls.
- Understanding these patterns, web designers can place Heatmaps act as a cognitive lens, bringing into focus how users interact with a website, which can greatly influence conversion optimization strategies. Leveraging heatmaps can uncover usability problems, enhance content positioning, and refine the user journey, ultimately contributing to higher conversion rates.
Key Types of Website Heatmaps and Their Use Cases
1. Scroll Maps:
Scroll maps are a vital tool in understanding how visitors engage with your website. Here’s why they’re essential:
- Increase Engagement: A scroll map reveals if your content is captivating enough to keep readers scrolling.
- Content Placement: Essential information should be placed ‘above the fold,’ ensuring it’s seen without scrolling.
- Conversion Insights: Discover which content drives conversions and what might be causing visitors to leave.
- User Interaction: Understand how users interact with different elements like menus and dynamic features.
- Visual Data: Heatmaps offer clear, visual data to identify user behavior patterns efficiently.
By using a scroll map, you can optimize your content, enhance user experience, and ultimately improve your website’s effectiveness. Whether it’s repositioning calls-to-action (CTA) or making your homepage more engaging, scroll maps guide your design decisions, backed by user-driven data.
2. Click Maps:
Click maps show where users click on your site, highlighting the hotspots and dead zones in your web design.
- They’re vital for optimizing calls to action (CTAs) like ‘buy now’ or ‘sign up,’ ensuring the key elements grab attention.
- On mobile, they’re called touch maps and track taps instead of clicks, a key insight for mobile-friendly websites.
- Use click maps to detect if users are trying to interact with non-clickable elements, indicating a potential enhancement to user experience.
- By understanding where visitors prefer to click, you can adjust your page layout to increase conversion rates and improve your site’s performance.
Remember, where users click is often where their interest lies, so aligning this data with your webpage design can lead to a more intuitive user journey, driving more traffic and conversions.
3. Move Maps:
Move Maps, also known as Mouse Tracking Heatmaps, show where users linger with their cursors on a webpage.
- They reveal which sections grab attention as users subconsciously point to areas of interest while reading or browsing.
- Hot spots indicate more engagement, meaning these are areas you might want to optimize or place key information.
- Understanding these patterns can improve website design and user experience, keeping users engaged longer.
Use cases:
- Web designers use Move Maps to refine layout and content placement.
- Marketers analyze these heatmaps to position CTAs effectively.
- UX teams study cursor movement to streamline navigation paths.
Keywords: move maps, mouse tracking heatmaps, website engagement, webpage hot spots, user experience
4. Engagement Zones
Engagement Zones are critical on a website, and heatmaps spotlight where users are most active. These zones show where visitors click, hover, and spend time. They’re key for understanding user behavior.
- Heatmaps reveal if people are clicking on CTAs or ignoring them.
- They show if users read content fully or skim.
- By displaying hotspots, heatmaps help optimize page elements for better user interaction.
- Understanding engagement zones aids in refining the layout and content to boost conversions.
To sum up, engagement zones on heatmaps offer invaluable insights into user interaction, guiding website improvements and enhancing user experience.
5. Rage Click Map
A Rage Click Map is indispensable for spotting user irritation on your website. It pinpoints the spots where users click excessively and repeatedly, signaling confusion or annoyance, usually because they expect an action that isn’t happening. Utilizing this type of heatmap, you can enhance website navigation, rectify misleading elements, and streamline your user experience, leading to a smoother journey and higher conversion rates. It’s essential for diagnosing and fixing issues that drive potential customers away, making your site more effective and user-friendly.
6. Device-Specific Heatmaps (Desktop, Tablet, Mobile)
Device-specific heatmaps are like X-ray vision for your website’s performance across desktop, tablet, and mobile. Here’s why they’re a game-changer:
- Targeted Improvements: By spotting how users interact on different gadgets, you can tweak things for better engagement. Too much scrolling on mobile? Fix it. Buttons getting ignored on tablets? Make them pop!
- User Behavior Insights: These heatmaps show you where your audience clicks, taps, and loses interest. Are they missing that flashy ‘Buy Now’ on their phone? Time for a redesign.
- Boost Conversions: Understanding device usage helps pinpoint where customers drop off. Simplify that complex form on mobile, and watch your sales climb.
So, for any savvy website owner, employing device-specific heatmaps means crafting a user-friendly experience no matter the screen size. Get the right tool, install it, and start optimizing your site for those taps and clicks. It’s crucial for keeping up with the mobile-first world!
Benefits of Using Heatmaps for Website Optimization
Heatmaps are invaluable tools for businesses seeking to enhance their website design, minimize bounce rates, and foster improved engagement. By leveraging the visual representation of user behavior that heatmaps provide, organizations can gain actionable insights into how visitors interact with different elements of their website. Here’s how heatmaps contribute to these improvements:
Enhanced Website Design:
- Heatmaps offer a graphical representation of where users click, move, and scroll, highlighting the areas that attract the most attention. This data-driven information enables designers to make informed decisions about element placement and prominence.
- By analyzing click maps, businesses can understand which buttons or links users engage with the most, informing them on how to optimize the site layout to encourage interaction with desired calls to action.
- Scroll maps indicate how far down a page users typically read, guiding designers on the best placement for important content to ensure it is seen.
- A detailed understanding of which parts of the site users interact with allows designers to declutter the layout, remove unnecessary distractions, and streamline the user journey.
Reduced Bounce Rates:
- Identifying ‘dead zones’ with minimal engagement or areas causing confusion allows businesses to make improvements that keep users on the page longer.
- Heatmaps can show if Heatmaps serve as a powerful tool for businesses aiming to refine their website’s design, reduce bounce rates, and foster better engagement. By visualizing user behavior, heatmaps offer a unique perspective on how visitors navigate and interact with a site, which in turn enables businesses to make data-informed optimizations.
How to Create and Set Up a Website Heatmap
Here’s a detailed step-by-step guide on setting up a heatmap on your website using popular tools such as Hotjar, Mouseflow, and Crazy Egg. In this instance, we’ll primarily use Hotjar as the example due to its commonality, however, the general process is similar across most tools.
Identify Your Goal:
- Start by defining the objective of your heatmap analysis.
- Examples of goals could be to understand how users navigate your product page, where they click most on a landing page, or to assess the effectiveness of call-to-action elements.
Choose the Right Heatmap Tool:
- Research available tools keeping in mind your needs—Hotjar, Mouseflow, and Crazy Egg are popular choices.
- Consider aspects such as ease of use, data segmentation capabilities, technical requirements for installation, and the comprehensiveness of the reports they offer.
Create an Account and Set Up Your Project:
- Register for an account with the chosen tool (e.g. Hotjar).
- Add your website details to create a new project.
Install Tracking Code:
- Once you have your project, the tool will provide you with a JavaScript snippet.
- Install this snippet into the HTML of your website just before the closing tag for global tracking, or on specific pages if you prefer targeted insights.
- Ensure verification of the installed tracking code within the heatmap tool dashboard.
Select the Page for Heatmap Tracking:
- Choose a page that receives significant traffic and is crucial for your business goals, like your homepage, pricing, or checkout page.
- Confirm your selection within the heatmap tool by specifying the URL or page rules.
Choose the Type of Heatmap:
- Based on your goal, select the most appropriate type of heatmap:
- Click maps for seeing where users click on the page.
- Move maps to understand where users move their mouse on the screen, which can be indicative of reading patterns.
- Scroll maps to see how far down users are scrolling and where they drop off.
- Eye-tracking maps, if available, for the most accurate representation of where users look.
Configure Your Settings:
- Set the sample size and data capturing duration; this should reflect your typical traffic to ensure data reliability.
- Some tools like Crazy Egg allow adjustments to the color contrast of the heatmap for better clarity.
- Determine advanced settings, like filtering traffic, excluding IPs, or targeting specific user segments, if these features are offered by the heatmap tool.
Launch the Heatmap Analysis:
- With all settings configured, start the heatmap analysis.
- Depending on the tool, you may be able to do this instantly or need to wait for the data to accumulate.
Monitor and Analyze Results:
- Allow sufficient time for data collection, keeping in mind traffic patterns and business cycles.
- Regularly check the heatmap results through the heatmap tool’s dashboard.
- Explore different filters to analyze data from various angles (e.g., by date, device type, or traffic source).
Leverage Integrations and Additional Features:
- If available, utilize integrations with other tools like A/B testing functionalities that some heatmap tools provide.
- Plugins can facilitate the use of heatmaps on platforms such as WordPress or Shopify.
- Some tools, like Mouseflow, provide individual session recordings for deeper insights into user interactions.
Understand Pricing Options:
- Before committing long-term, understand the pricing tiers offered by the heatmap tool.
- Look for any available free trials or demos to test the tool’s effectiveness for your specific needs. For example, Crazy Egg offers heatmap demos and varying pricing
Heatmap FAQs: Common Questions Answered
How Do I Create a Website Heatmap?
Creating a website heatmap starts with identifying a goal like improving usability or increasing sales. Select an analytics tool that suits your needs and install it on your page. Choose from scroll, click, or eye-tracking maps to analyze customer interactions. Set it up on high-traffic pages and capture data for meaningful insights.
Will Heatmaps Slow Down My Website?
No, employing heatmaps typically doesn’t slow down your website. Modern heatmap tools are designed to be lightweight and run in the background without affecting page load times. By tracking clicks, scrolls, and interactions discreetly, they gather valuable user engagement data without impacting site performance or user experience.
Where Can I Find a Free Website Heatmap?
Looking for a free website heatmap tool to optimize your site’s usability and increase conversions? Popular options include Hotjar’s free version for basic heatmaps and Google Analytics for data-driven insights on user behavior. Just sign up and integrate with your site to start tracking.
Can I Use a Heatmap on Shopify or WordPress?
Absolutely! Whether you’re running a Shopify store or a WordPress blog, you can integrate heatmaps to analyze visitor behavior. They’ll help you optimize your site layout, improve user experience, and potentially increase conversions. Just install a compatible heatmap plugin or tool, and start gaining valuable insights!
Can I Use Heatmaps and Comply with GDPR?
Yes, using heatmaps is GDPR compliant as long as you respect user privacy and data protection laws. Ensure you have clear consent from users, anonymize personal data, and inform visitors about the tracking through your privacy policy. Heatmaps are valuable for improving website usability and user experience, ultimately optimizing conversion rates while keeping user data secure.
What Do Heatmaps Show?
Heatmaps visually show where users click, scroll, and focus on a website. They reveal user engagement, helping improve page design and content quality for better SEO and conversions. By understanding user behavior, you can optimize web pages to keep users interested and boost your site’s performance.
How Should I Use Heatmaps Alongside Analytics Tools?
Utilize heatmaps in conjunction with analytics tools to enhance website optimization.
- Heatmaps show where users click, scroll, and focus, refining your analysis.
- Blend heatmap data with analytics for better conversion rate insights.
- Incorporate user behavior trends from heatmaps into your SEO strategy for improved user engagement.
- Regularly review heatmap findings to complement analytics for ongoing site improvements.
![]()