


Understanding Time to Interactive (TTI)
What Is TTI and Why Does It Matter?
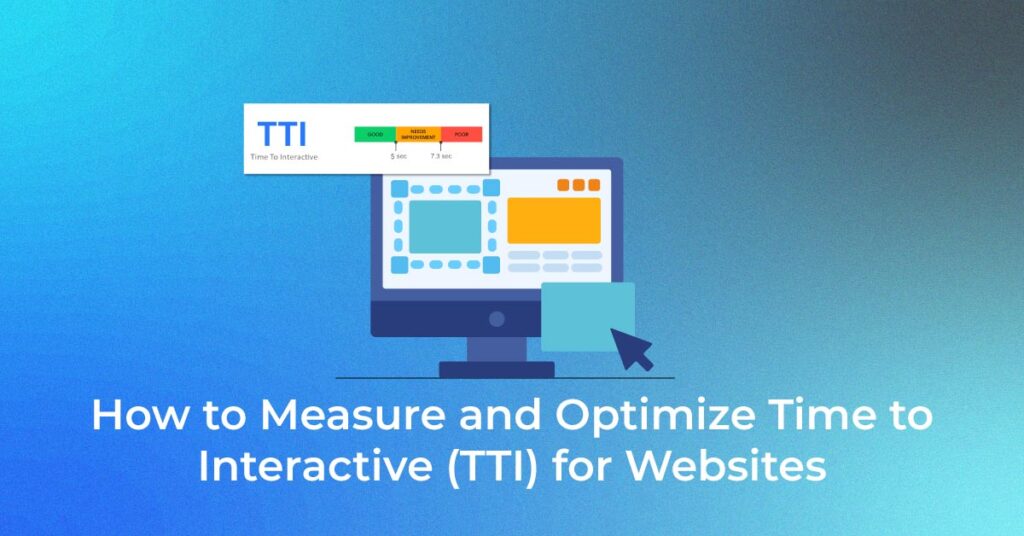
- Time to Interactive (TTI) is a performance metric that measures the time from when a page starts loading to when it’s fully interactive.
- This means the page displays useful content, event handlers are registered for most visible page elements, and the page responds to user interactions within a reasonable time.
- TTI matters because it reflects the real-world experience users have with a site. A faster TTI means users can begin interacting with content sooner, likely leading to increased user satisfaction and engagement.
The Relationship Between TTI and User Experience
A direct relationship exists between Time to Interactive (TTI) and user experience (UX). Slow TTI can result in laggy, unresponsive pages that frustrate users. This diminishes user satisfaction as people are often unable to interact with page elements immediately, despite them being visible.
Conversely, a swift TTI enhances UX by ensuring that the page is both visually ready and capable of handling user interactions promptly, which provides a smooth and enjoyable experience. As you pay attention to optimizing TTI, you’re essentially prioritizing the usability and enjoyment of your website – factors that are crucial for retaining visitors and converting them into regular users or customers.
Connection to Core Web Vitals
Time to Interactive (TTI) is not officially one of the Core Web Vitals – a set of metrics that Google emphasizes for evaluating user experience, such as Largest Contentful Paint (LCP), First Input Delay (FID), and Cumulative Layout Shift (CLS).
However, TTI is closely related to these vitals, particularly to FID, as both measure interactivity. Although TTI doesn’t directly impact your Google rankings, optimizing it can indirectly benefit your Core Web Vitals. For instance, improving TTI often means reducing long tasks that can also positively affect your FID scores. Thus, while TTI isn’t a Core Web Vital, it still plays a vital role in the overall perception of your site’s performance.
How Time to Interactive is Measured
Tools for Assessing TTI: From Lighthouse to WebPageTest
While the Time to Interactive (TTI) metric was previously prominent in the Lighthouse tool, it has been recently deprecated in Lighthouse version 10. However, there are still a variety of tools available for assessing interactivity metrics that closely relate to TTI. These include:
- Google’s PageSpeed Insights: Integrating Lighthouse-powered analyses, provides a comprehensive overview of web performance, including metrics that have replaced TTI, like Total Blocking Time (TBT) and Interaction to Next Paint (INP).
- WebPageTest: This tool allows more in-depth analysis and multiple test runs, providing advanced insights into interaction readiness, among various performance metrics.
- GTmetrix: Similar to the others, GTmetrix combines multiple performance indicators, giving you a holistic view of potential interactivity issues.
Even with changes in metrics, these tools continue to offer valuable information to help diagnose and optimize the interactive readiness of your web pages.
Step-by-Step Guide to Measuring TTI on Your Website
To measure Time to Interactive (TTI) for your website, you can follow these steps:
- Choose Your Tool: Although TTI is no longer part of the Lighthouse score as of version 10, you can use tools that measure similar interactive metrics, like WebPageTest.
- Configure Your Test: Go to WebPageTest.org, enter your website’s URL, and select test location and browser configurations that most closely match your user demographics.
- Run the Test: Click on the ‘Start Test’ button. WebPageTest will analyze your website across different performance metrics, including TTI, providing a detailed report of your site’s responsiveness.
How TTI Impacts User Perception
The impact of Time to Interactive (TTI) on user perception cannot be understated. A web page with a quick TTI is perceived as concise and responsive, leading to a positive user experience and a greater likelihood that the user will perceive the website as reliable and professional. This can increase user trust and confidence in using your site for their needs or services.
Conversely, a slow TTI can leave a negative impression, as users may become impatient or assume the website is broken if they are unable to interact with it promptly. The perception of your site’s quality and the trustworthiness of your brand can be severely impacted if users consistently encounter poor interactivity and responsiveness.
- Analyze the Results: Once the test is complete, examine the results focusing on the TTI and other interactivity metrics listed. This could include metrics like Total Blocking Time (TBT) or First Input Delay (FID) which are related to TTI.
- Plan for Optimization: With your results, identify areas causing delays and make a plan for optimizing your site’s interactivity. This may involve reviewing and improving JavaScript execution, reducing large network payloads, or improving server response times.
Remember, this process is not a one-off task—it’s crucial to regularly test and analyze your site to ensure the best user interactivity.
Why Time to Interactive Matters for Your Website
1. Impact on User Experience
- The impact of TTI on user experience is profound. Users expect web pages to be interactive as soon as they appear to be loaded, and any delay in interactivity can lead to frustration and confusion.
- This is especially crucial for complex web applications where users might be completing important tasks, like filling out forms or making purchases.
- A faster TTI ensures these interactions can happen without delay, effectively keeping users engaged and reducing the chances that they’ll leave the site in favor of one with better performance.
- A smooth interactivity without noticeable lag encourages users to explore further, potentially increasing the time they spend on the site, lowering bounce rates, and enhancing their overall experience.
2. Impact on SEO
- Time to Interactive (TTI) significantly influences SEO, despite not being a direct Google ranking factor. Since major search engines prioritize user experience, a slow TTI, which hampers UX, can indirectly impact a website’s rankings.
- Slow-to-interactive sites may face higher bounce rates as users leave due to frustration with unresponsive pages, which search engines interpret as a sign of poor user experience.
- As search algorithms become more refined, they increasingly favor websites that load quickly and are interactive, thus making TTI optimization a smart strategy for improving your search engine ranking.
- Enhanced TTI also means better engagement, another positive signal to search algorithms that your site provides valuable content, which can lead to improved organic search visibility.
Best Practices for Consistently Good TTI Scores
Time to Interactive (TTI) is a web performance metric that measures the time it takes for a web page to become fully interactive—meaning users can click, scroll, and interact without delay. TTI is critical for assessing user experience and ensuring a website responds quickly to input. Here are some tools and techniques commonly used to measure TTI:
Tools and Techniques to Measure TTI
- Lighthouse: Lighthouse is a free, open-source tool from Google that measures TTI as part of its performance metrics. Lighthouse provides a detailed report on TTI and other Core Web Vitals, with specific guidance on areas for improvement.
- PageSpeed Insights: Also powered by Lighthouse, this tool provides TTI metrics along with other web performance statistics. It combines field data and lab data to provide TTI insights in real user conditions.
- WebPageTest: This tool measures TTI and other performance metrics by running tests across different browsers and device configurations. It also provides a filmstrip view to help visualize when a page becomes interactive.
- Chrome DevTools: TTI can be analyzed directly through Chrome DevTools in the “Performance” panel. By running a performance trace, developers can pinpoint when TTI occurs and identify main-thread activity that may be causing delays.
Optimization Techniques for Improving TTI
- Code Splitting and Lazy Loading: By breaking up JavaScript bundles and only loading what’s necessary for initial interactivity, developers can reduce TTI. Tools like Webpack can help manage code splitting.
- Reducing JavaScript Execution Time: Minimizing JavaScript that runs on the main thread, especially long-running tasks, helps make pages interactive faster. Tools like Lighthouse will point out such tasks.
- Using Web Workers: Offloading non-UI JavaScript work to Web Workers helps reduce main-thread blocking, improving TTI. Web Workers execute scripts in a separate thread, which prevents blocking of the main thread.
- Minimizing Render-Blocking Resources: Identifying and deferring resources that block rendering, such as large CSS files or synchronous JavaScript, can significantly reduce TTI. Techniques like async and defer attributes for scripts and inlining critical CSS can help.
TTI is crucial for improving user experience, and these tools and techniques together provide a comprehensive approach for both measurement and optimization.
How to Optimize Time to Interactive
Optimizing Time to Interactive (TTI) involves reducing main-thread activity, minimizing render-blocking resources, and improving the efficiency of JavaScript execution. Here are key strategies:
- Minimize JavaScript Execution:
- Reduce the amount of JavaScript loading initially by removing unnecessary scripts or splitting code.
- Use code-splitting tools like Webpack to load only essential JavaScript on page load and defer other scripts.
- Defer or Async JavaScript:
- Apply the async or defer attributes to non-essential scripts to prevent them from blocking the main thread during the critical render path.
- Use Web Workers:
- Offload complex calculations or non-UI tasks to Web Workers, which allows JavaScript to run in a separate thread and reduces main-thread blocking.
- Reduce Render-Blocking Resources:
- Inline critical CSS to ensure it loads quickly and defer non-critical CSS.
- Remove unused CSS or JavaScript that could slow down rendering and delay interactivity.
- Optimize Images and Fonts:
- Use modern formats like WebP for images and lazy-load non-essential images.
- Use font-display strategies (like font-display: swap) to avoid blocking interactivity for font loading.
- Improve Server Response Time:
- Implement caching, use a Content Delivery Network (CDN), and optimize server configurations to ensure resources load as quickly as possible.
FAQs
What Is Considered a Good TTI Score?
A good TTI score is typically 3.8 seconds or less, as this indicates a page is interactive quickly enough for a positive user experience.
Can TTI Affect My Site’s SEO Performance?
Yes, TTI can impact SEO performance since Google uses page speed and interactivity as ranking factors. A lower TTI improves user experience, which can lead to higher search rankings and better engagement metrics, both of which positively influence SEO.
What causes a high TTI, and what can slow it down?
High TTI is often caused by long-running JavaScript tasks, large scripts, and excessive main-thread activity, which delay the page from becoming fully interactive. Heavy resource loading (like unoptimized images or CSS) and render-blocking resources can also slow TTI, as they compete for processing time.
How does TTI relate to Core Web Vitals?
TTI complements Core Web Vitals by measuring how quickly a page becomes interactive, whereas Core Web Vitals focus on loading, interactivity (via First Input Delay), and visual stability. Together, they give a holistic view of page performance, user experience, and responsiveness.
What tools can help me track and improve TTI?
Tools like Google Lighthouse, Chrome DevTools, and WebPageTest can help track and improve TTI by analyzing load times, main-thread activity, and optimization opportunities.
Regular Monitoring and Maintenance Tips?
Regularly monitor TTI and Core Web Vitals using tools like Lighthouse or WebPageTest, optimize code, and update dependencies to maintain fast, interactive page performance.
![]()