


Key Performance Indicators (KPIs) are usually associated with job roles. However, this is a misconception. Marketing strategies also have KPIs that need to be tracked.
Tracking marketing KPIs helps you evaluate how your marketing campaigns are performing. This evaluation supports making informed decisions at the right time. By tracking your marketing KPIs, you can make adjustments to your strategy and budget and beat your competition in the long run.
The focus should be on the right marketing KPIs that suit your business. It is because the types of marketing KPIs you choose are directly linked to your business growth. If you don’t choose appropriate KPIs, you may miss critical information and end up making poor decisions.
You may want to put all your efforts into tracking leads, sales, or Customer Acquisition Cost (CAC) for your PPC ads. There are several other metrics you should track to succeed.
Marketing KPIs are necessary for business growth. Here are seven marketing KPIs examples for reference:
Sales figures
One of the simplest ways to track the types of marketing KPIs is through sales figures. You can use sales figures as an apt marketing KPI example to track your business growth. This metric tracks and measures the performance of your sales team and the sales activities executed. You can optimize your sales performance, sales cycle length, and sales funnel by optimizing sales figures.
However, sales KPIs depend on your business goals. The best marketing KPI for you may not be the best for someone else. Remember to use the financial metric that is best suitable for your business model and planning.
For example, SaaS products can focus on Annual Recurring Revenue (ARR) or Monthly Recurring Revenue (MRR) as a marketing KPI. On the other hand, VC-backed organizations can use the “grow at all costs” model to succeed even when costs are higher than revenue.
How do you quantify it?
Sales figures are pretty easy to gauge as they are value-based. You can simply use a dashboard and measure your sales KPIs. A sales dashboard is a visual representation of sales data that you can filter, view, or segment at different periods. With a dashboard, you can control your sales functions, identify potential issues and optimize your sales process easily.
In other words, a sales dashboard represents your sales metrics and KPIs in real-time. It can either be in the form of a spreadsheet or as a dashboard and reporting tool.
However, sales teams tend to throw too many metrics when it comes to sales KPIs. This makes it difficult to see what’s actually happening. A better way to build your sales dashboards is to set strategic marketing objectives.
You can also use Enhanced ECommerce tracking tools like Google Analytics for marketing analysis. You need to remember that web analytics tools are not accurate and may not track each and everything. So, avoid using those figures for your sales KPI.
Gross or net profit margins, sales revenue, funnel flow, sales targets, closing rates, customer retention, etc., are some of the sales KPIs you should consider measuring.
Acquisition of users and customers
Acquisition of users and customers is an important step for your business growth. It refers to how many new customers or profiles you are adding to your customer base. The three levels of user and customer acquisition include leads, prospects, and customers.
Accelerating the growth of your user base may not lead to more profits, but it does impact your business success. Acquisition of more users and customers leads to enhanced brand awareness. It also increases word of mouth, resulting in the long-term growth of your business.
The ultimate marketing KPI of any business is to increase its customer base. Therefore, it is crucial to track user and customer acquisition efforts. Customer acquisition metrics are an excellent way to ascertain if your marketing campaigns are attracting the right customers or not. They also offer you a clear insight into how you can improve your marketing strategies.
How do you quantify it?
Some of the marketing KPIs examples to measure the acquisition of users and customers include:
- Conversion rate
- Demo signups
- Revenue by channel
- Revenue by marketing activity
- Lifetime value
- Annual contract value
- Customer Acquisition Cost (CAC)
- Click Through Rate (CTR)
- Cost Per Click (CPC)
Lead quantity and quality
Lead generation is one of the most important strategic marketing objectives set by companies to achieve desired growth. You have to put marketing efforts across several channels to gain leads. But how can you measure the actual impact of your lead-generation tactics?
The answer lies in marketing KPIs for lead quantity and quality. The metric lets you know the impact of your marketing efforts in attracting prospects and converting them into paying customers.
Low lead quality and quantity lead to low conversion rates and more bounce rates. More number of interested prospects implies a greater success of your marketing tactics. So, your lead quantity and quality ultimately determine the growth in your customer base and sales.
Further, your lead generation campaign can help you reach many prospects. These prospects may not always have the intent to purchase. Many of them may be interested in just researching what you offer. Hence, the quality of leads is an essential marketing KPI to track. It allows you to measure the number of prospects that are actually interested in buying from you.
How do you quantify it?
You can easily know about the number of leads through your Customer Relationship Management (CRM). However, tracking the quality of your leads requires more effort and planning. This is where lead scoring comes into play.
You can create an automated system that scores each lead according to the relevant data provided. You can also choose CRM platforms that come with built-in lead-scoring functionality. Whatever you choose, make sure it suits your business goals.
You can consider the following data when measuring your lead quantity and quality:
- Actions taken by users on your website or app
- Trail tier and set up
- Any communication of users with your customer support or sales team
- Data generated from the user registration stage
Customer Lifetime Value (CLV)
One of the marketing KPIs examples is Customer Lifetime Value or CLV. This metric lets you know the total revenue you can expect from a single customer. CLV considers factors such as average transaction value, customer purchase frequency, or the duration of the relationship with your company. What’s the point of measuring CLV?
CLV is a useful metric as it gives you the long-term value of your customers and helps to set strategic marketing objectives for customer acquisition and retention. It helps you allocate resources efficiently, target the right audience and make informed decisions about your sales and marketing strategies.
You must have a few years of sales history to measure CLV. Once you have this, you can also identify which of the three metrics need optimization. You can view each of these inputs as levers that can be pulled to increase your CLV.
How do you quantify it?
The formula to calculate CLV is as follows:
CLV= AOV*PF*CL
Where;
- AOV stands for Average Order Value
It represents the average amount spent by a customer per purchase. You can start by identifying the value of your average sale. If you lack data spanning an extended period, you can consider one or three months as a proxy for a year.
- PF stands for Purchase Frequency
It represents the average number of purchases a customer makes within a given period. Does a customer buy several times a week or only once every few years? The purchase frequency is a critical driver of CLV.
- CL stands for Customer Lifespan
It represents the average duration a customer remains associated with your company. For example, automobile or technology brands have lifelong loyal customers. But retail chains may have less loyal customers.
Let’s consider an example to understand the CLV metric:
Suppose your APV is $100, and a customer makes the purchase six times a year and does business with you for four years on average. Then your CLV would be as follows:
CLV=100*6*4=$2400
Calculating CLV can be difficult if you don’t have good tracking systems. A CRM or Enterprise Resource Planning (ERP) can make things simpler. It makes the entire information available on automated dashboards that track KPIs.
SOV (Share of Voice)
The Share of Voice metric represents the share of your advertising compared to your competition. Or you can say it helps compare your brand awareness across different marketing channels against your competitors.
This marketing KPI for b2b was mainly used to measure the impact of paid advertising. By measuring your SOV, you will better understand how much people know about your company and which areas need improvement. For example, if you have more share of voice in organic traffic but not that much on social media, you know where you need to put more effort.
While the share of voice and market share may sound similar, these two are not the same. SOV gauges your brand awareness on different channels. On the other hand, market share is the percentage of the market you control in terms of sales and customers.
Nonetheless, SOV has a correlation with your market share and revenue. For example, if you have a higher SOV in online conversation, you’ll have a higher market share and more authority among people. Once your SOV exceeds your market share, you build excess SOV (eSOV).
How do you quantify it?
Getting one SOV number that covers all your marketing channels can be tricky. To make things simple, you can choose a metric for every channel that represents the SOV. Then, you can calculate the ratio by dividing your brand’s measure by the total market measure.. For this, you will require some marketing tools.
For example, you can use a social media automation tool to count your brand mentions. Now calculate the mentions of your competition. After adding everything, you can divide your social media mentions by the total to get the SOV percentage.
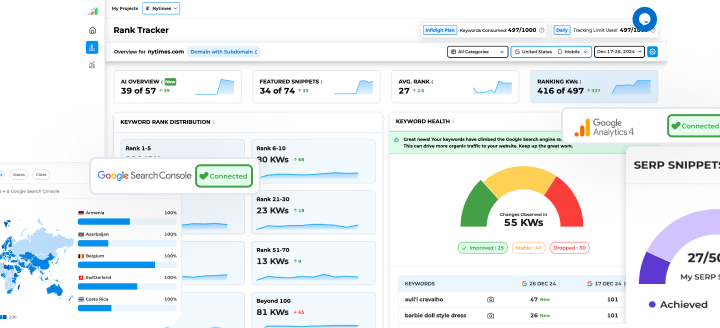
For organic search, Rank Tracker is an excellent tool to monitor your SOV and that of your competitors’. All you need to do is track your keywords in the Rank Tracker, add domains of your competitors, and see the visibility in the Competitors Overview tab.
Here are some marketing platforms and their KPIs that can represent your SOV:
- Social media: Brand mentions against your competitors
- Paid search: Impression share
- TV ads: Gross Rating Points (GRP)
- Organic Search: Visibility in Search Engine Results Pages (SERPs)
Metrics for brand awareness
Brand awareness marketing KPIs must be a part of your marketing agenda. Since brand awareness plays a prominent role in customers’ purchase decisions, it impacts your overall business growth. It helps people to recognize, relate and recall your brand. Therefore, building brand awareness has the potential to convert strangers into satisfied and long-term customers.
But even if you have the right brand-building strategies in place, it is essential to measure brand awareness. This is because, brand awareness reflects your brand’s visibility and sentiment on various platforms.
Do people recognize your brand within your industry? Do they resonate with your positioning? You need to get answers to these important questions. You can do so by measuring your brand awareness. It helps you track your business progress, allocate resources effectively, and optimize brand awareness strategies.
Your way of measuring brand awareness may depend on your goals, audiences, and marketing channels. You can choose from multiple brand awareness KPIs and track your brand perception over a specific period.
These metrics can help measure your brand awareness, ROI (return on investment) of awareness campaigns, monitor performance, and much more.
How do you quantify it?
While brand awareness metrics are crucial for your business, measuring them can be tricky. Some of the metrics you can use to calculate your brand awareness include:
- Website Traffic
Your site traffic not only shows that people are becoming aware of your brand but also indicates they want to learn more about you.
- Brand impressions
Brand impressions indicate how many people were shown your content. From this, you can see metrics like clicks, engagement, and website traffic and understand how your target audience viewed your campaign content.
- Earned or free media value
Earned media refers to third-party publicity for which you didn’t pay. It can include social media mentions, mentions on blogs, and more. Measuring earned media helps you know who is talking about your brand and in what way.
- Social media engagement
Does your brand have a positive or negative awareness on social media? Is this awareness encouraging users to follow you? Social media engagement tells how people are engaging with your brand on social media through likes, comments, or shares.
- Search volume data
Search volume data lets you know about the level of interest surrounding your brand. It also reflects how your search volume stands up against your competitors.
- Brand awareness surveys and interviews
Brand awareness surveys or interviews can offer context to your quantitative data. They also help you build connections with your audiences. You can conduct surveys via email, website forms, or phone calls.
- External links
Measuring your external links is another metric for brand awareness. It helps you identify where your site is linked improperly or misspelled. This ensures you don’t miss out on any valuable opportunities to boost your brand awareness.
Net Promoter Score (NPS)
Net Promoter Score is a great way to know and understand your customers.
The loyalty and satisfaction metric of your customers can be gauged with NPS. It is a survey that asks customers to respond on a scale of 0-10. The score reflects how likely they will recommend your product or service to friends or colleagues.
NPS is widely used by customer support and marketing teams due to its simplicity. It solely focuses on customer satisfaction and brand loyalty to measure an organization’s performance.
Customer responses on the NPS scale indicate whether they are detractors, passive, or promoters. The NPS classifies respondents who choose any number less than 7 as “Detractors.” Respondents who choose any number between 7-8 are classified as “Passives.” At last, respondents selecting numbers between 9 and 10 are classified as “Promoters.”
Breaking down your customers can help you follow up with the detractors or passives. This way, you can find out why these customers are not your promoters and how you can satisfy them.
How do you quantify it?
To calculate your NPS score, you first need to subtract the number of detractors from that of promoters. Then divide by the total number of respondents and multiply by 100. The score can lie anywhere between -100 and 100. Any scores above zero indicate your promoters exceed your detractors. A greater number of satisfied customers implies higher growth.
You can choose from several NPS survey distribution channels, such as online, physical, and email. And there are many software that can provide you with an NPS score. But remember that this is just a score. You should look beyond and try to understand the reason behind the customer responses. You can also leave extra space for comments or ask follow-up questions when calculating your NPS. This allows you to extract qualitative data.
Lastly, don’t establish any marketing KPIs without any specific purpose. For long-term success, you need to set strategic marketing objectives that use these metrics.
![]()